Reading the river
The river is the home view: one row per dimension value (a distribution center, a product category, and so on) and one segment per month. Color shows how each segment compares to its baseline. Thickness shows the chosen height metric.
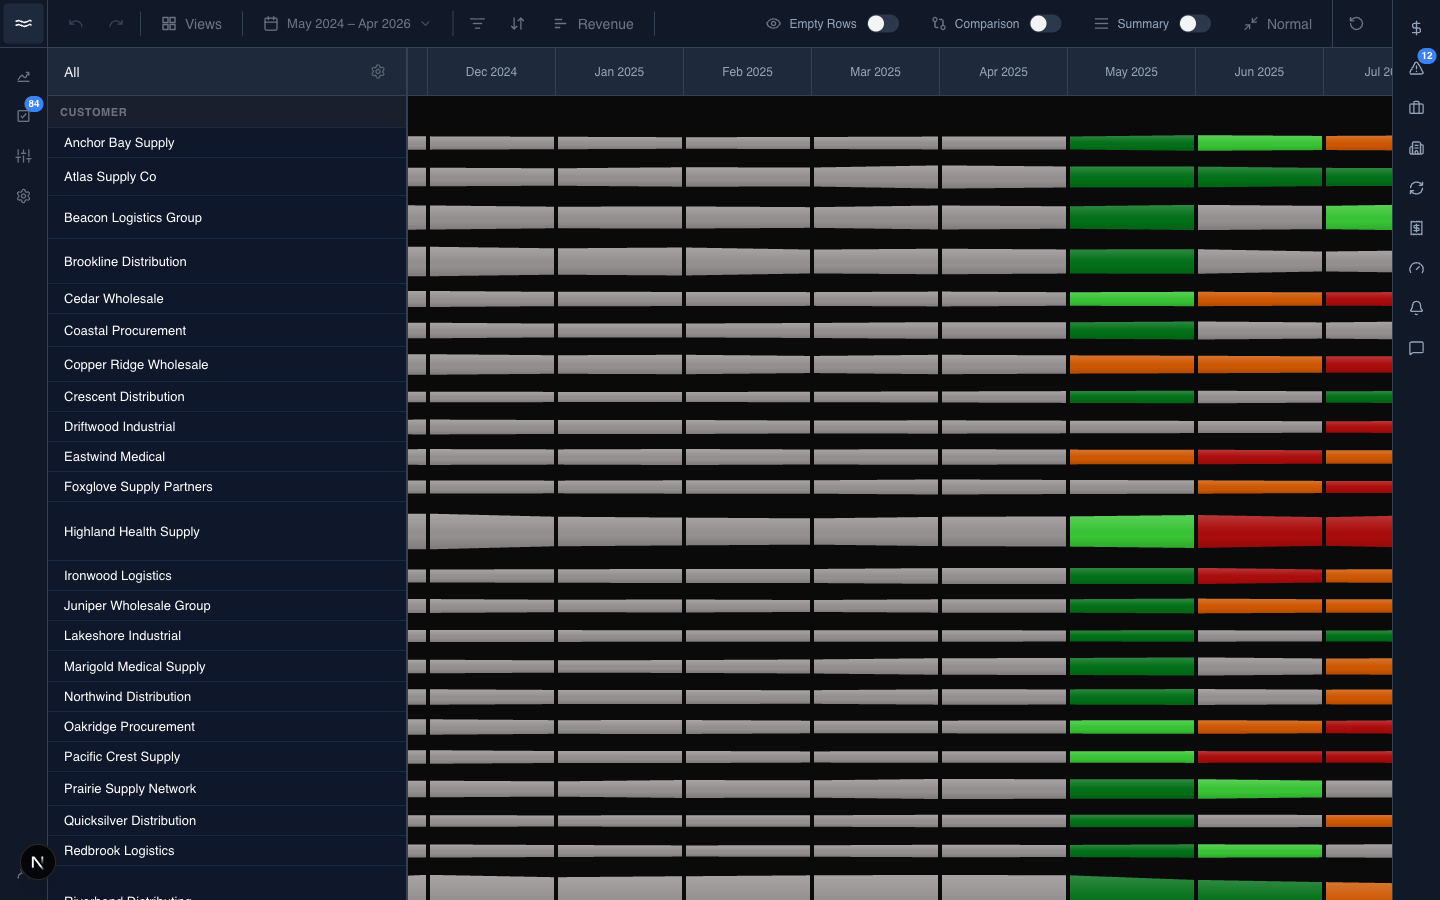
The canvas, bands, and time header
The Y-axis on the left lists the bands. The time header runs across the top. The current month is highlighted. The pending month renders with a striped pattern and reads (in progress) on hover, so it does not look like a drop in volume.
Under the toolbar, the params bar states the whole configuration in one sentence: measure, grouping, filters, range, baseline, and sort. It updates live as you change controls.
Scrolling and panning
Click and drag, or scroll horizontally with the wheel, to pan through time. The canvas, time header, Y-axis, and summary row scroll together.
Drilling in and out
Click a cell in the Y-axis, or right-click a band and choose Drill down, to filter the river to that band's contents. The breadcrumbs above the Y-axis show the active drill path. Click a crumb to step back, or All to reset.
To drill into the records behind one month of one band, hover the segment and click the View Revenue → action in the tooltip (the label follows the current measure). See Records.
Display options
The layout switches are in the toolbar's Display popover: Empty Rows, Values, Flat Bottom, Stepped, Proportional bands, Log scale, Group Small Accounts, Stacked, and Summary. See Toolbar and Views for what each does.
The view mode button switches the layout itself:
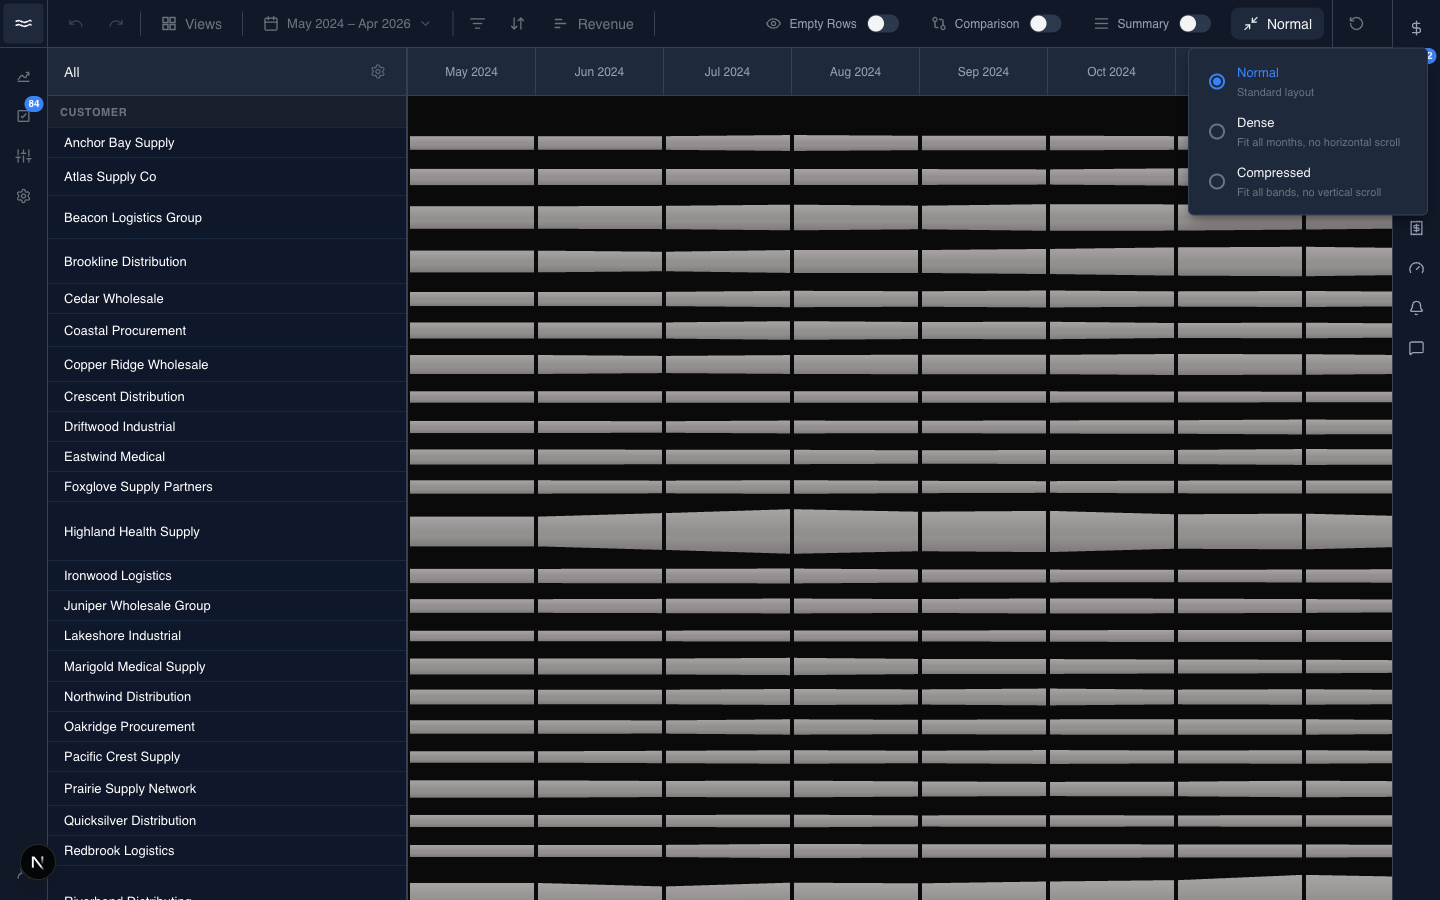
- Normal: standard layout.
- Dense: fit all months in the viewport, with no horizontal scroll.
- Compressed: fit all bands in the viewport, with no vertical scroll.
Comparison mode
Comparison splits the canvas into two periods side by side, which helps you spot month-over-month or year-over-year shifts. It is under the Compare tab of the date range picker:
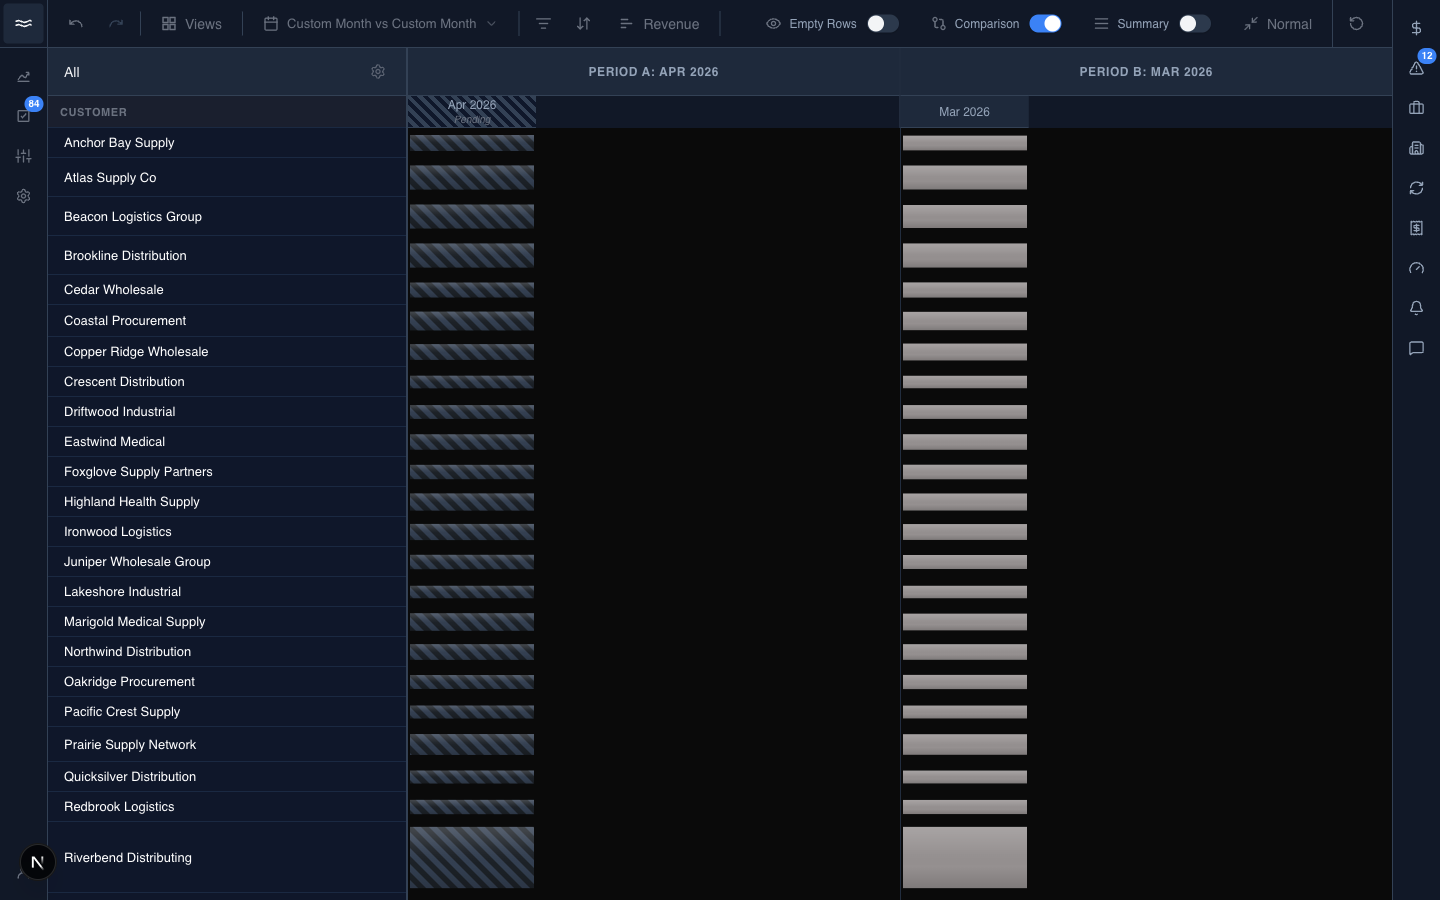
Pick a comparison type (prior month, same month last year, trailing average, or two custom periods). The toolbar's date button then shows Period A vs Period B. The view mode locks to Normal while comparing. Only the two periods are stored in the URL, so the exact preset name does not always survive a reload.