Bands and segments
A band is one row of the river: one account, one SKU, or one value of whatever you grouped by. A segment is one month within that band. Read color for status and thickness for volume.
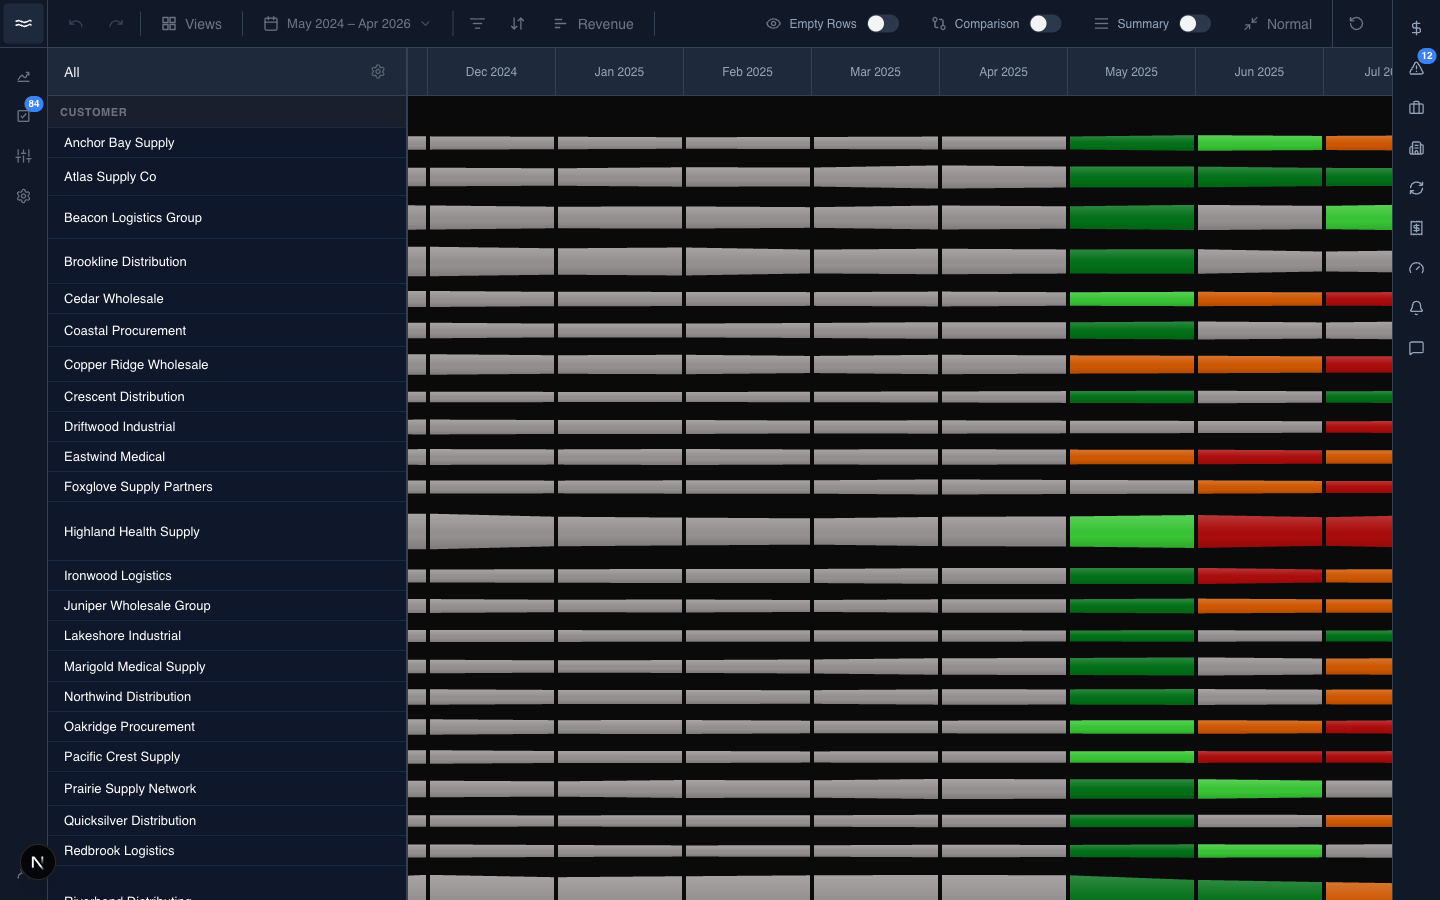
What the colors mean
Each segment is colored by how it compares to the baseline picked in the toolbar (same month last year by default):
- Big Drop: significant decline (red by default).
- Small Drop: mild decline (orange).
- Flat: inside the flat range (gray).
- Small Growth: mild growth (light green).
- Big Growth: significant growth (dark green).
The percent cutoffs and the colors are configurable per org; see Adjust Thresholds under the date range button. The pending month renders with a striped pattern instead of a status color.
Inspecting a segment
Hover a segment for its summary: the band, the month, the current height metric's value, and the status with its percent change:
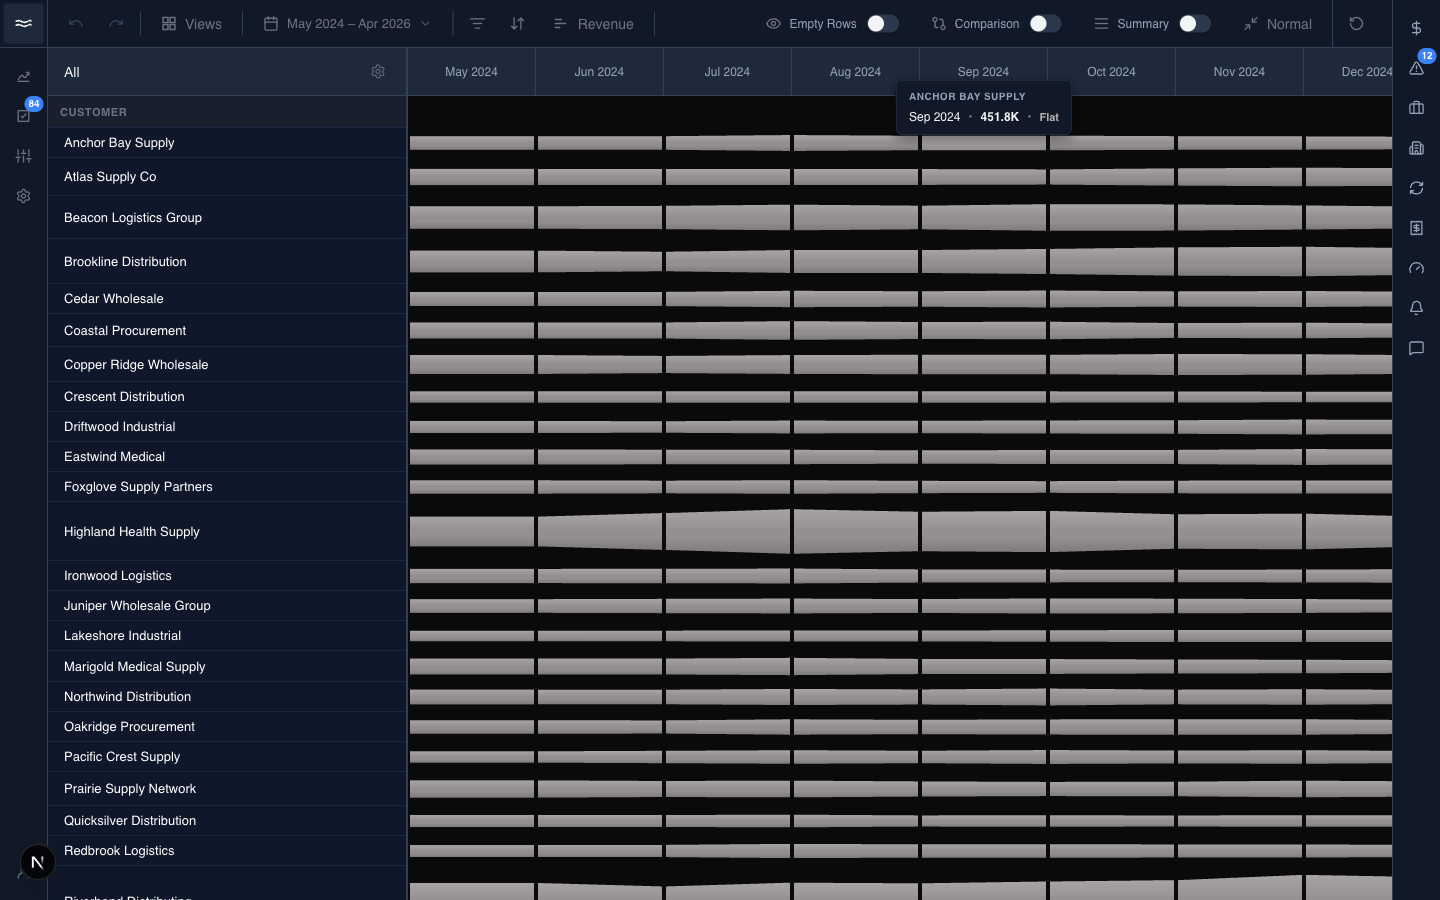
The tooltip stays open long enough for you to reach the View Revenue → button at its base (the label follows the current measure). Clicking the button opens the records behind that exact bar, scoped to that band and month: the individual invoices, credits, or cases that sum to the displayed number. Measures with a native tab (support cases, deductions, rebates) open in their own panel. All other measures open the generic Records panel.
Right-click actions
Right-click a band to open the action menu:
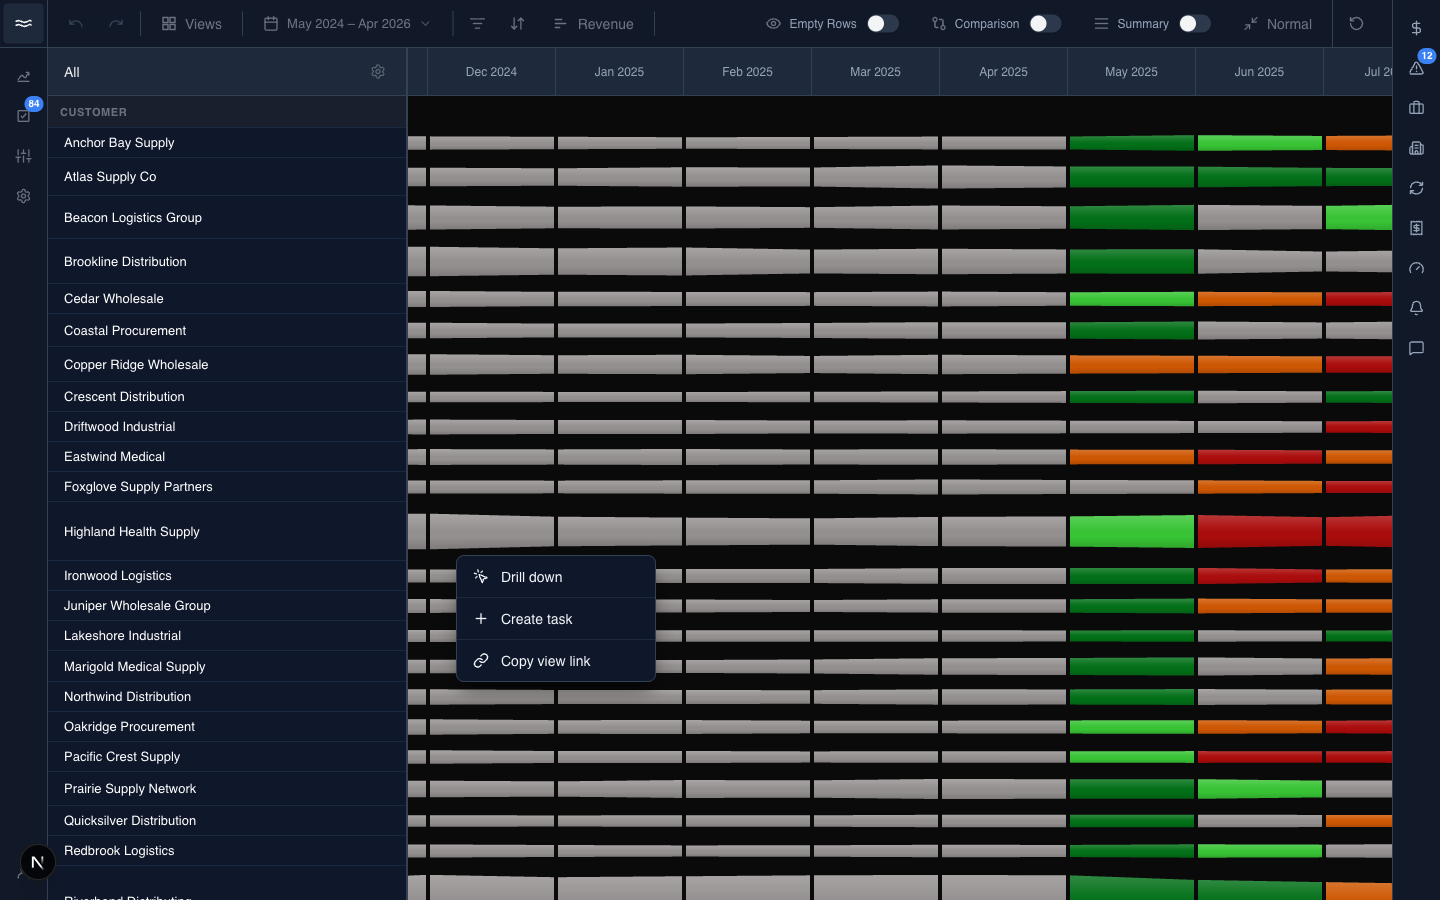
- Drill down: filter the river to this band's contents, the same as clicking the Y-axis cell. The label becomes Undrill Down when you are already drilled in.
- Create task: open the task composer with this band pre-filled as the linked entity.
- Copy view link: copy a shareable URL that reproduces the current view. The label changes to "Copied" briefly to confirm.
Markers on the bands
Issue pills and deal badges draw on top of segments when enabled from the toolbar's Icons popover. See Issue indicators and Deals.